
Strategic Metrics and Data

Strategic Metrics and Data

Goal 1 Metrics and Data

Develop the next generation of science leaders, mentors and culture shapers.

23 OSU Distinguished Professors
Current only; 72 over all time

2 National Academy members
Current only; 5 over all time

14 AAAS Fellows
Current fellows only

1 MacArthur Fellows
Current fellows only

12 OSU Endowed Scholars and Professors
Current faculty


Goal 2 Metrics and Data

Lead in fundamental, use-inspired and transdisciplinary scientific research, scholarship and innovation.

This data reflects data available through OSU Academic Unit Assessment Collection as of 10/15/23. Research expenditures for FY 2023 are not yet available.

If this table is not accessible for your device, you can find the data in a different format in the section below titled "Data: Research Funding Metrics."

College of Science Award Metric

2018

2019

2020

2021

2022

2023

State, federal and industry awards

63

72

77

65

56

76

External awards (total $)

$12.9M

$19.2M

$16.8M

$26.4M

$19.1M

$26.6M

Research expenditures

$11.9M

$16.5M

$13.5M

$22.2M

$17.1M

Internal seed funding (College)

$82K  
7 Awards

$160K  
3 Awards

$278K  
8 Awards

$100K  
9 Awards

$380K  
13 Awards

$135K  
8 Awards

Internal seed funding (University)

$2.45M  
20 Awards

$2.05M  
29 Awards

$1.912M  
34 Awards

$1.98M  
33 Awards

$2.48M  
31 Awards

$1.91M  
41 Awards

In these metrics, K represents thousands and M represents millions

State, federal and industry awards

  • 2018: 63
  • 2019: 72
  • 2020: 77
  • 2021: 65
  • 2022: 56
  • 2023: 76

External awards (total $)

  • 2018: $12.9M
  • 2019: $19.2M
  • 2020: $16.8M
  • 2021: $26.4M
  • 2022: $19.1M
  • 2023: $26.6M

Research expenditures

  • 2018: $11.9M
  • 2019: $16.5M
  • 2020: $13.5M
  • 2021: $22.2M
  • 2022: $17.1M

Internal seed funding (College)

Total $1.135M over 48 Awards

  • 2018: $82K over 7 awards
  • 2019: $160K over 3 awards
  • 2020: $278K over 8 awards
  • 2021: $100K over 9 awards
  • 2022: $380K over 13 awards
  • 2023: $135K over 8 awards

Internal seed funding (University )

  • 2018: $2.45M over 20 awards
  • 2019: $2.05M over 29 awards
  • 2020: $1.91M over 34 awards
  • 2021: $1.98M over 33 awards
  • 2022: $2.48M over 31 awards
  • 2023: $1.91M over 41 awards

Goal 3 Metrics and Data

Deliver a 21st century high-quality, innovative science education that is equitable, accessible and inclusive of all learners.

Graph showing number of bachelors degrees broken down into several demographics. Exact data is available below, under Chart 3.1.1 Bachelor's Degrees Data

Description

Chart 3.1.1 shows the number of Bachelor's Degrees in the College of Science over the Academic years 2020-21, 2021-22 and 2022-23 and includes a note that the College of Science accounts for about 11% of OSU's total bachelor's degrees.

The chart shows total degrees earned, degrees earned by first generation students, and degrees earned by historically underrepresented students (acronym: HURS). There is some intersection between first generation and HURS demographics.

Data

Academic Year 20-21

  • Total degrees earned: 658
  • First generation degrees: 167
  • HURS degrees: 73

Academic Year 21-22

  • Total degrees earned: 642
  • First generation degrees: 143
  • HURS degrees: 81

Academic Year 22-23

  • Total degrees earned: 643
  • First generation degrees: 148
  • HURS degrees: 82

Graph showing number of master's degrees broken down into several demographics. Exact data is available below, under Chart 3.1.2 Master's Degrees Data

Description

Chart 3.1.2 shows the number of Master's Degrees in the College of Science over the Academic years 2020-21, 2021-22 and 2022-23 and includes a note that the College of Science accounts for 7-9% of OSU's total master's degrees.

The chart shows total degrees earned, degrees earned by first generation students, and degrees earned by historically underrepresented students (acronym: HURS). There is some intersection between first generation and HURS demographics.

Data

Academic Year 20-21

  • Total master's degrees earned: 71
  • First generation master's degrees: 31
  • HURS master's degrees: 6

Academic Year 21-22

  • Total master's degrees earned: 94
  • First generation master's degrees: 30
  • HURS master's degrees: 6

Academic Year 22-23

  • Total master's degrees earned: 81
  • First generation master's degrees: 27
  • HURS master's degrees: 2

Graph showing number of doctoral degrees broken down into several demographics. Exact data is available below, under Chart 3.1.3 Doctoral Degrees Data

Description

Chart 3.1.3 shows the number of Doctoral Degrees in the College of Science over the Academic years 2020-21, 2021-22 and 2022-23 and includes a note that the College of Science accounts for 4-5% of OSU's total doctoral degrees.

The chart shows total degrees earned, degrees earned by first generation students, and degrees earned by historically underrepresented students (acronym: HURS). There is some intersection between first generation and HURS demographics.

Data

Academic Year 20-21

  • Total doctoral degrees earned: 50
  • First generation doctoral degrees: 51
  • HURS doctoral degrees: 48

Academic Year 21-22

  • Total doctoral degrees earned: 18
  • First generation doctoral degrees: 27
  • HURS doctoral degrees: 20

Academic Year 22-23

  • Total doctoral degrees earned: 4
  • First generation doctoral degrees: 5
  • HURS doctoral degrees: 2

Graph showing the percent of first-year students from cohorts over the last six years who continued on in the College of Science or at Oregon State University. More details are available below, under Chart 3.2.1 First Year Retention Rates.

Description

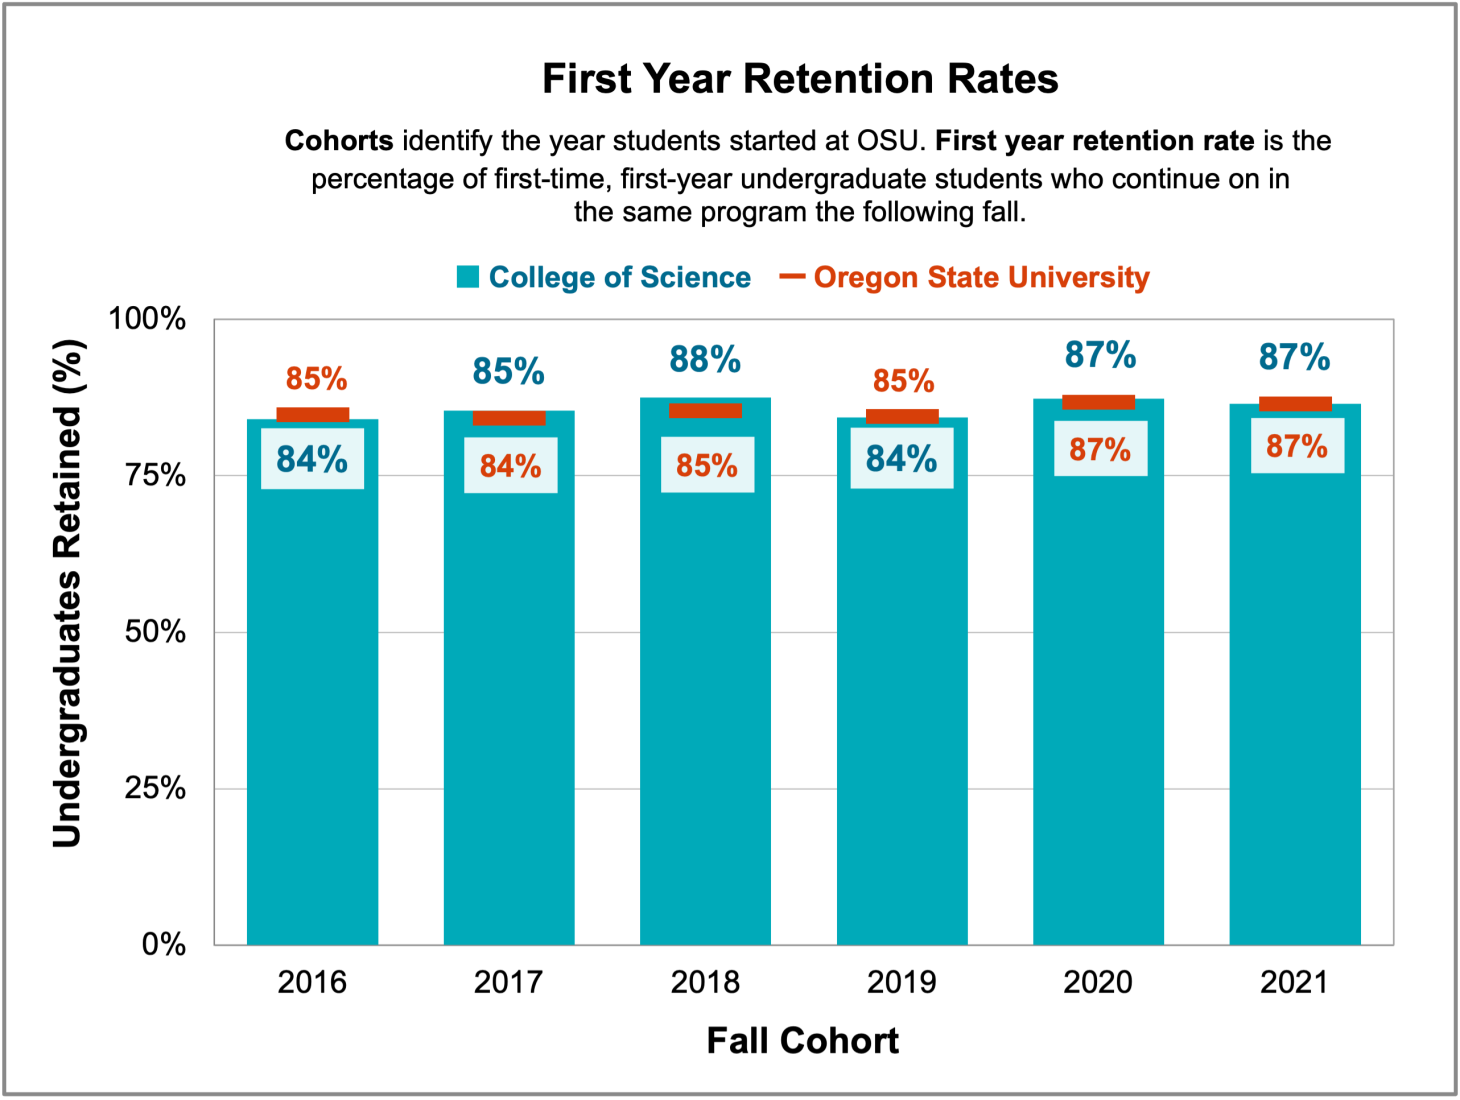
Chart 3.2.1 shows the First Year Retention Rates in the College of Science of Fall Cohorts from 2016 through 2021.

The Fall Cohort identifies the year students started at OSU.

First year retention rate is the percentage of first-time, first-year undergraduate students who continue on in the same program the following fall.

The chart shows the College of Science’s first year retention rates compared to Oregon State University as a whole. First year retention in the College has met or exceeded that of OSU in four out of the past six years and has been within one percentage point the other two years.

Data

First year retention rates for each cohort.
In the following, COS stands for College of Science

  • Fall 2016 Cohort: 84.0% COS and 84.8% OSU
  • Fall 2017 Cohort: 85.4% COS and 84.2% OSU
  • Fall 2018 Cohort: 87.5% COS and 85.4% OSU
  • Fall 2019 Cohort: 84.3% COS and 84.5% OSU
  • Fall 2020 Cohort: 87.3% COS and 86.8% OSU
  • Fall 2021 Cohort: 86.5% COS and 86.5% OSU

Graph showing the percent of students over the last seven years who graduated within six years in the College of Science and at Oregon State University. More details are available below, under Chart 3.3.1 Six Year Graduation Rates

Description

Chart 3.3.1 shows the Six Year Graduation Rates in the College of Science of Fall Cohorts from 2010 through 2016.

The Fall Cohort identifies the year students started at OSU, while the six-year graduation rates track how many students graduated within six years. For example, graduating by Spring 2022 for a member of the Fall 2016 cohort.

The chart shows the College of Science’s six year graduation rates compared to Oregon State University as a whole. The College has met or exceeded OSU’s six-year graduation rates each of the past seven years.

Data

Six year graduation rates for each cohort.
In the following, COS stands for College of Science

  • Fall 2010 Cohort: 66.8% COS and 63.3% OSU
  • Fall 2011 Cohort: 67.6% COS and 65.3% OSU
  • Fall 2012 Cohort: 70.4% COS and 67.0% OSU
  • Fall 2013 Cohort: 68.4% COS and 67.1% OSU
  • Fall 2014 Cohort: 70.4% COS and 69.2% OSU
  • Fall 2015 Cohort: 68.4% COS and 68.1% OSU
  • Fall 2016 Cohort: 72.5% COS and 69.9% OSU

Graph showing the percent of junior transfer students who graduated within four years of transferring to the College of Science and to Oregon State University. More details are available below, under Chart 3.4.1 Four Year Junior Transfer Graduation Rates.

Description

Chart 3.4.1 shows the Four Year Junior Transfer Graduation Rates in the College of Science of a transfer cohort from 2011 through 2018.

The Fall Cohort identifies the year students transferred to OSU, while the four-year graduation rates track how many of those students graduated within four years. For example, graduating by Spring 2022 for a student who transferred in Fall 2018.

The chart shows the College of Science’s four year graduation rates compared to Oregon State University as a whole. The College has exceeded OSU’s four-year junior graduation rates each of the past seven years and by three percentage points or more over the last three years.

Data

Four Year Junior Transfer Graduation Rates for each cohort.
In the following, COS stands for College of Science

  • Fall 2012 Cohort: 58.1% COS and 57.1% OSU
  • Fall 2013 Cohort: 59.3% COS and 55.9% OSU
  • Fall 2014 Cohort: 65.4% COS and 62.4% OSU
  • Fall 2015 Cohort: 60.9% COS and 60.6% OSU
  • Fall 2016 Cohort: 67.3% COS and 59.2% OSU
  • Fall 2017 Cohort: 67.5% COS and 61.2% OSU
  • Fall 2018 Cohort: 64.4% COS and 61.3% OSU