Fraunhofer interference and diffraction patterns from single and double slits.
References: Bayman & Hammermesh sec. 4.2; Tipler & Mosca sec. 33.5.
Version 0.2
To do:
(i) Add slits
(ii) Adjust normalization for multiple slits?
(iii) Resolve singularities at multiple slit peaks
(iv) Parameterize wavelength better/differently?
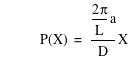
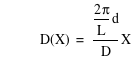
I0 – single-slit intensity; a – slit width; d – slit separation; L – wavelength (as a multiple of d); D – distance to screen (so tanT=x/D gives the position on the screen corresponding to angle T. For small angles note sinT = tanT = x/D.)
![]()
![]()
![]()
![]()
Phase difference between rays from top and bottom of each slit as a function of screen position (X):
Phase difference between rays from centers of adjacent slits as a function of screen position (X):
Intensity for single-slit diffraction pattern:
![function(I_1,X)=I_0*[sin(function(P,X)/2)/[function(P,X)/2]]^2](formula11.png)
Intensity for two-slit interference-diffraction pattern (note how interference term is modulated by the single-slit diffraction pattern):
![]()
Intensity for two-slit interference pattern (neglecting diffraction):
![]()
Intensity for m-slit diffraction pattern:
![function(I_N,X,m)=function(I_1,X)*[sin([m*function(D,X)/2])/sin([function(D,X)/2])]^2](formula17.png)
Envelope for m-slit diffraction:
![]()
Location of intensity maxima as a function of position on the screen.
![]()
To plot as a function of angle replace x->Dsinx:
![]()
![]()
![]()
![]()
![]()
![]()
Bragg condition. d is now the interplanar spacing.
![]()
Author: David A. Craig <http://web.lemoyne.edu/~craigda/>

This file was created by Graphing Calculator 3.5.
Visit Pacific Tech to download the helper application to view and edit these equations live.